
We make decisions all day, every day. Most of them are low stakes—like deciding to skip a song on Spotify, or gauging how big your coffee mug needs to be this morning. (Probably pretty big.)
But for product teams, the stakes are much higher. Prioritizing what to build next means balancing user needs, business goals, and internal opinions—all under tight deadlines. Take too long, and you lose momentum. Move too fast, and you risk building the wrong thing.
That’s where a product prioritization framework comes in. It helps you make smarter decisions, faster, so your team can focus on what actually moves the needle.
This guide explains what goes into a product prioritization framework and how to choose one for your team. It also provides 4 example frameworks to help you get started.
What is a product prioritization framework?
Your team can’t work on every idea and initiative simultaneously, so you need to choose your next steps carefully. Product prioritization weighs ideas against constraints and opportunities to help you pick which product to create or initiative to work on next.
A product prioritization framework is a repeatable process to consider variables for potential initiatives. Following a framework ensures you don’t forget to consider something essential or let personal bias get in the way.
4 common factors of product management decision-making
Product prioritization frameworks help you streamline decision-making and reduce mental fatigue, but they're not all the same. For example, some frameworks base decisions on revenue costs or gains, while others put user needs front and center.
While there's not a one-size-fits-all framework for every team, here are 4 categories of key variables you’ll come across in most product prioritization frameworks:
1. Quantitative data
Nothing cuts through personal bias quite like cold, hard facts. Quantitative data lets you compare and communicate quantifiable metrics and goals like revenue, retention, and activation.
Examples of quantitative data from product research you could use in product prioritization include
Filtering session recordings by date and user attributes to measure how many new users exited your site before making it to an important step in the user journey
Using a Net Promoter Score® (NPS®) as evidence that a customer segment who uses a particular product is unhappy
Ranking issues on a page based on heatmap data—for example, are users scrolling far enough down a key page to know which step to take next?
💡Pro tip: use Contentsquare Heatmaps to cut through the noise and get clarity on what’s working (and what’s not). Whether it’s a buried CTA or a section no one’s scrolling to, the tool helps you prioritize fixes based on real user behavior—not assumptions.
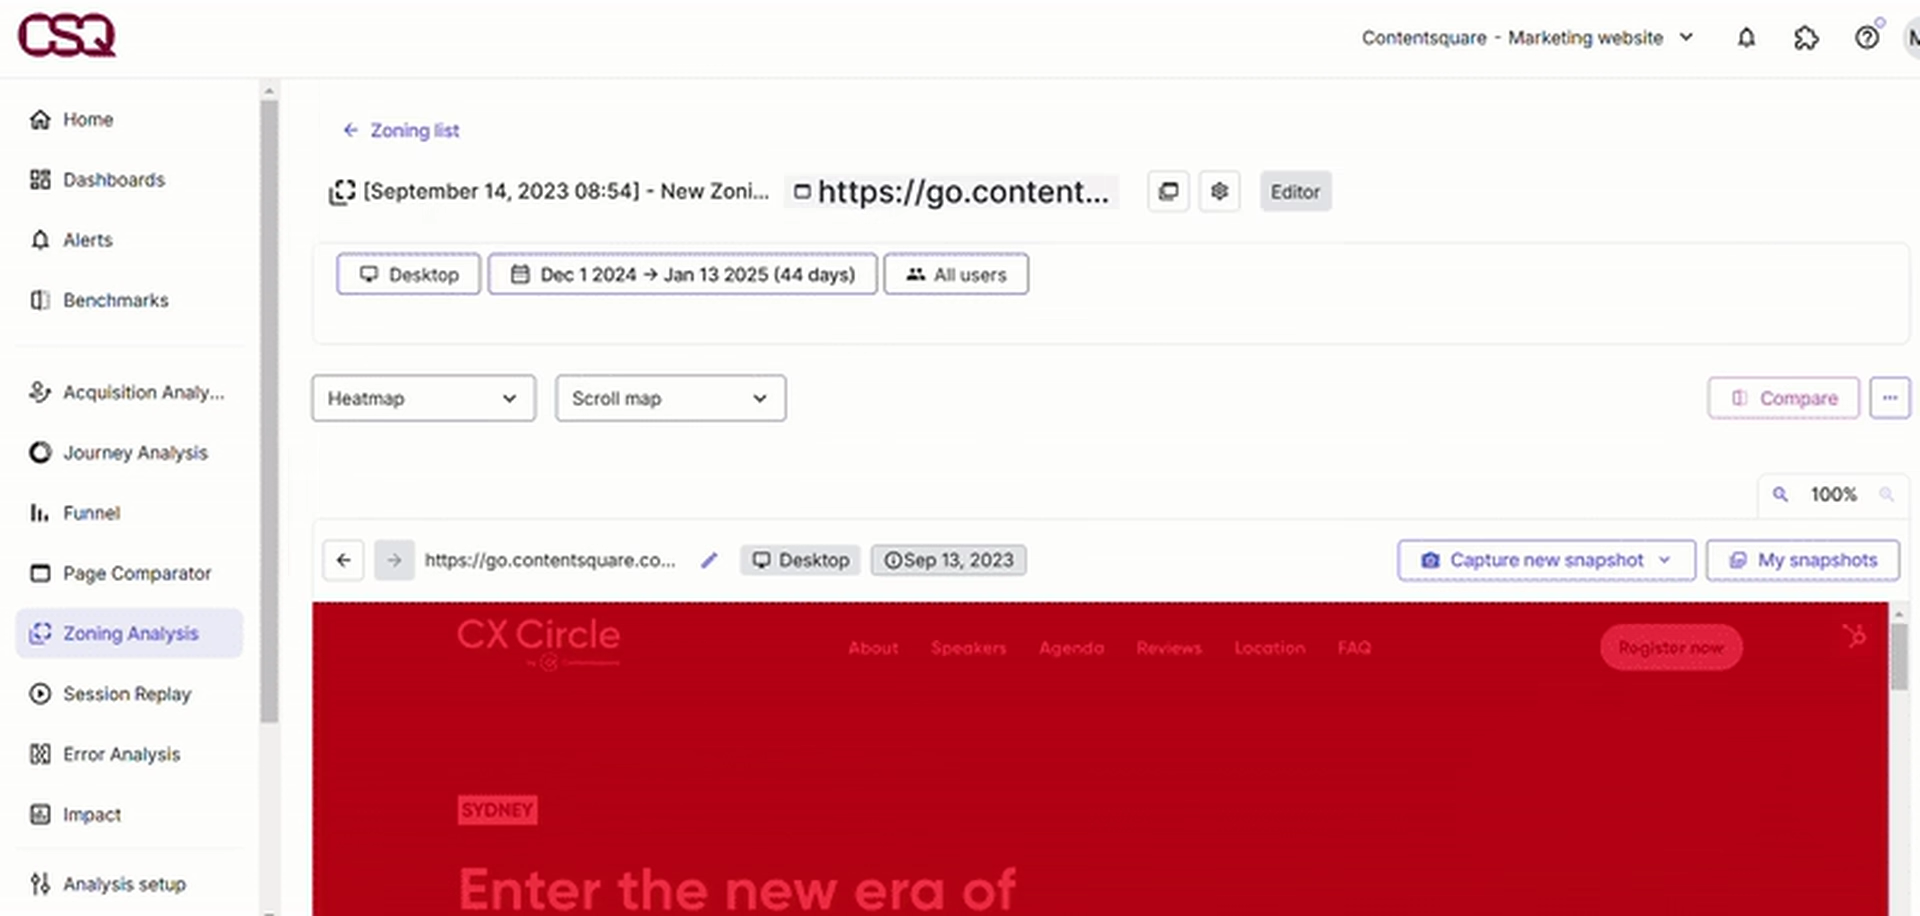
See how far users scroll down your page with Contentsquare Heatmaps
2. Qualitative insights
Your users aren’t robots or numbers on a page, so adding qualitative data to your decision-making adds critical context. Reviewing unmeasurable feedback also helps you build empathy for users.
Attison Barnes, Co-founder & Head of Product at Captain Experiences, says: “If you aren't using qualitative and quantitative research to inform your product strategy, you will fail. The flip side of this is that organizations can get carried away with data analysis. At the end of the day, it’s up to the product manager to use their discretion, make decisions, and be willing to admit when things don't work and may need to be rolled back or edited.”
Examples of qualitative insights that will add perspective to your product prioritization framework include
Sending customer surveys with open-ended questions to learn about user goals and priorities you hadn’t considered
Reviewing user feedback from your product experimentation to determine whether you resolved customer issues—or if you missed the mark
Mapping the full user journey with session replays to understand how individual users combine features
💡Pro tip: combine Contentsquare’s Session Replay and Journey Analysis tools to get a full, qualitative picture of what users actually experience—not just what they click.
Watching real user sessions and mapping their paths across your site builds empathy and context you won’t get from numbers alone. Whether they’re bouncing from frustration or circling back to explore, these behaviors can reveal friction you didn’t know existed—and help you prioritize fixes that actually move the needle.
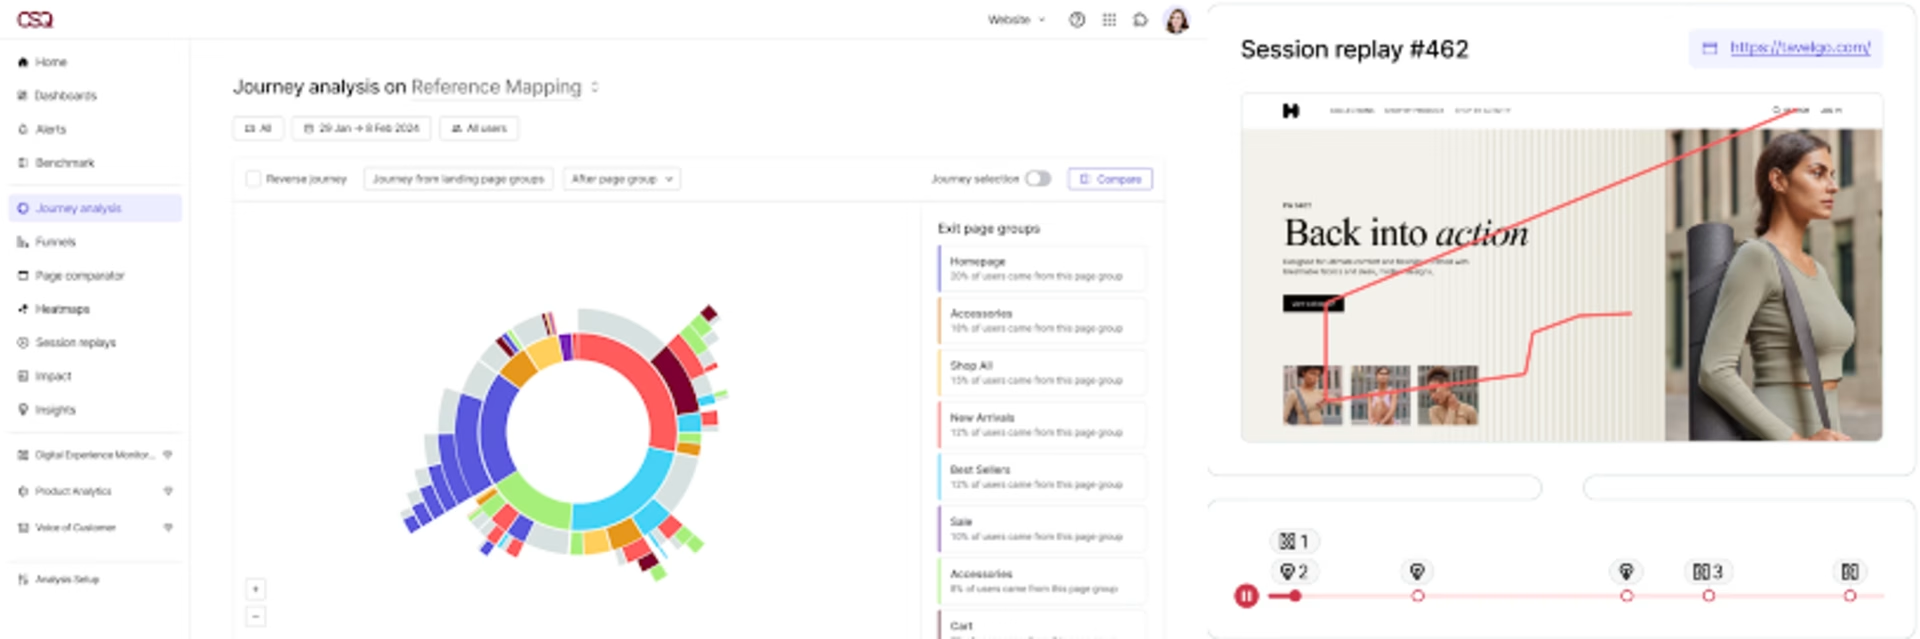
Contentsquare’s powerful Session Replay and Journey Analysis tools uncover insights into user behavior that help you prioritize fixes
3. Company goals
Since your product team doesn’t work in a vacuum, you have to align your work with company goals and priorities. In turn, it's easier to get buy-in and build products that move the needle on KPIs.
Matthew Ramirez, the Director of Product at WriteLab and Founder at Rephrase Media, uses business goals to prioritize features: “If you have high confidence that implementing a product feature can lift a core KPI, such as revenue, it should go on the strategic product roadmap. If there is more uncertainty around the payoff or the effort still needs to be sized up, it should go in the product backlog.”
Examples of company goals that will affect your product prioritization include
Focusing on increasing retention within a specific timeframe
Trying to get product-market fit for a new user segment
Moving quickly to be the first solution with a particular product feature, or to be the first to solve a particular job-to-be-done (JTBD)
4. Team resources
Finally, consider your team’s availability and resources during product prioritization. Gauging how long initiatives will take helps you fit products into a given sprint or timeframe.
A few examples of scenarios that could impact product prioritization include
Two teammates focusing on a new product launch for the upcoming quarter and can’t take on other projects
Planning to grow your product team in the coming months
Wanting a quick win after completing a big product push
💡Pro tip: if you’re facing prioritization roadblocks, channel your inner PANDA!
What does that mean? A PANDA 'Prioritizes Amazingly and Needs Data Always'. A product manager who uses a data-informed approach to decision making can
Focus on tasks that add real value to the product
Keep the product team aligned on priorities
Build trust with stakeholders
4 product prioritization frameworks to try
When choosing a product prioritization framework, consider which factors align most with your product roadmap and positioning, and what will help you get buy-in from stakeholders.
You don't have to stop there, either; you can tweak an established framework if it isn’t right. We suggest getting started using an existing one as a base and then tailoring it to make it your own.
Here are 4 product prioritization models to explore:
1. RICE
The RICE framework makes product prioritization decisions based on 4 factors: reach, impact, confidence, and effort. This framework could be a good choice if you’re looking for one that lets you weigh initiatives differently.
RICE framework pros:
Refer to multiple factors for a well-rounded decision
Weigh decisions based on confidence
Gauge a product’s impact on users
RICE framework cons:
Have to calculate figures for each potential product
Can get hung up on the specifics of the numbers
If you’re worried about calculating exact reach and impact, focus on how your products relate to one another. You can get more value from using frameworks to regularly assess the relative priority of each initiative against each other, instead of attempting to estimate the absolute priority of each piece of work as accurately as possible.
💡Pro tip: getting the right sample size on your survey increases confidence that the results accurately reflect your audience. Check out our favorite sample size formula and calculator in this guide.
Population Size | Sample Size Needed for Accuracy |
200 | 132 |
2,000 | 323 |
20,000 | 377 |
200,000 | 384 |
2,000,000 | 385 |
20,000,000+ | 385 (yup, same as 2 million) |
A small audience requires a larger relative sample size for accuracy than a large population
How to use the RICE product prioritization framework
Measure reach. This is how many users will interact with a product in a given time. For example, 500 users a month.
Establish impact. How much will a feature boost revenue or increase adoption? Keep the timeframe consistent across variables, like weeks or months.
Adjust for confidence. If you don’t have the same data for each potential product, you can weigh them accordingly. For example, if you are twice as sure your assumptions are correct for one initiative, give it a factor of 2.
Calculate the required effort. The last component of the RICE model is the team effort. Estimate how long it will take your team to complete the product using the same timeframe you’ve been using.
Plug your numbers into the equation. Multiply R x I x C divided by E. A higher score is a higher priority because the output more heavily outweighs the input.
RICE Example | Product A | Product B |
|---|---|---|
Reach | 500 users per month | 300 users per month |
Impact | $5,000 revenue per month | $8,000 revenue per month |
Confidence | 1 | 1.5 |
Effort | 2 | 2 |
Calculation | (500 × 5,000 × 1) / 2 = 1,250,000 | (300 × 8,000 × 1.5) / 2 = 1, |
An example of the RICE product prioritization framework
2. MoSCoW
The MoSCoW product prioritization method puts product team and stakeholder input at the center of decision-making, based on 'must-have', 'should-have', 'could-have', and 'won't-have' criteria. As a result, this framework doesn’t explicitly consider potential revenue or workload. The MoSCoW method isn’t completely emotional, though, since you’ll qualify initiatives based on your product vision or roadmap.
MoSCoW method pros:
Stakeholders can vote on what they think is most important
Pick and choose products that fit with the company’s direction
MoSCoW method cons:
Involving too many opinions can slow down the process
Decisions made in a vacuum might not reflect the entire picture
Since the MoSCoW prioritization framework has subjective elements, it’s important to lay some groundwork before discussions begin: bring in user experience data where possible, to better understand the current climate and issues or opportunities at hand, and establish how you’ll break ties if conflicting opinions arise.
How to use the MoSCoW product prioritization framework
Organized product backlog management makes the MoSCoW method easier, since you’ll start with a list of potential product initiatives to categorize. There are a couple of potential approaches to putting products in the MoSCoW categories: you can either have everyone vote on where they believe a product should land or leave the decision to a specific person or team.
Pick 'must-have' product initiatives. The highest priority category, and the first letter of the framework’s acronym, are 'must-haves'. These are non-negotiable features that render a release useless if they’re absent.
Identify 'should-have' initiatives. The next priority tier adds significant value but isn’t mission-critical. These products elevate the user experience and would be helpful to include.
Label 'could-have' initiatives. Your third product priority adds minor benefits. If you have the time and resources, go ahead and add these to the queue. If not, don’t sweat it.
Put 'will not have' product initiatives out of mind. If your team wants to avoid scope creep, heed the 'will not have' initiatives. These are initiatives and ideas you can revisit in the future but won’t make the cut this time.
3. Kano
Consider the Kano model if you want to put user preferences at the heart of your decision-making. This prioritization framework ranks product ideas and features based on how likely they are to satisfy customer needs. Then, you can compare the level of customer delight to the implementation investment.
Kano method pros:
You don’t need to calculate specific revenue, effort, or cost—relative amounts will do
Putting customer needs first can help you increase satisfaction
Gauging user demand and reaction before work leads to more impactful initiatives
Kano method cons:
Doesn’t consider company goals
No place to work in insights from organizational awareness
While using user insights as your guiding light is a noble goal, you still need to make sure the decision aligns with your product positioning. Screen the list of products for fit before running them through the Kano framework.
How to use the Kano product prioritization framework
The Kano prioritization framework plots each potential product on a chart with customer delight on one axis and implementation effort on the other. Before you can graph out the initiatives, you’ll need to do some user research.
1. Research how users perceive features. While you could try to guess how your user base would react to a product, it’s best to bring in quantifiable evidence. Your Kano starting point is user surveys that gauge their sentiment toward existing and potential features. (like our very own feature prioritization survey)
2. Estimate the effort to create each product. You don’t need to calculate the exact workload with the Kano model, only relative requirements for the products at hand. Which of the initiatives you’re considering are low-hanging fruit versus intense product overhauls?
3. Categorize initiatives across Kano levels. The Kano method categorizes products into 3 categories of customer delight: basic, performance, and excitement features.
Basic features are what you need to stay competitive
Performance features have a 1:1 relationship between team effort and customer satisfaction
Excitement features have a disproportionately high level of customer delight, considering the required time investment
4. Decide what product category to prioritize. The Kano method helps you understand potential products, but it doesn’t tell you which is necessarily better. The basic features category helps you narrow your scope. Then, you can pick which performance features to implement and whether there are any relatively easy excitement features to work on.
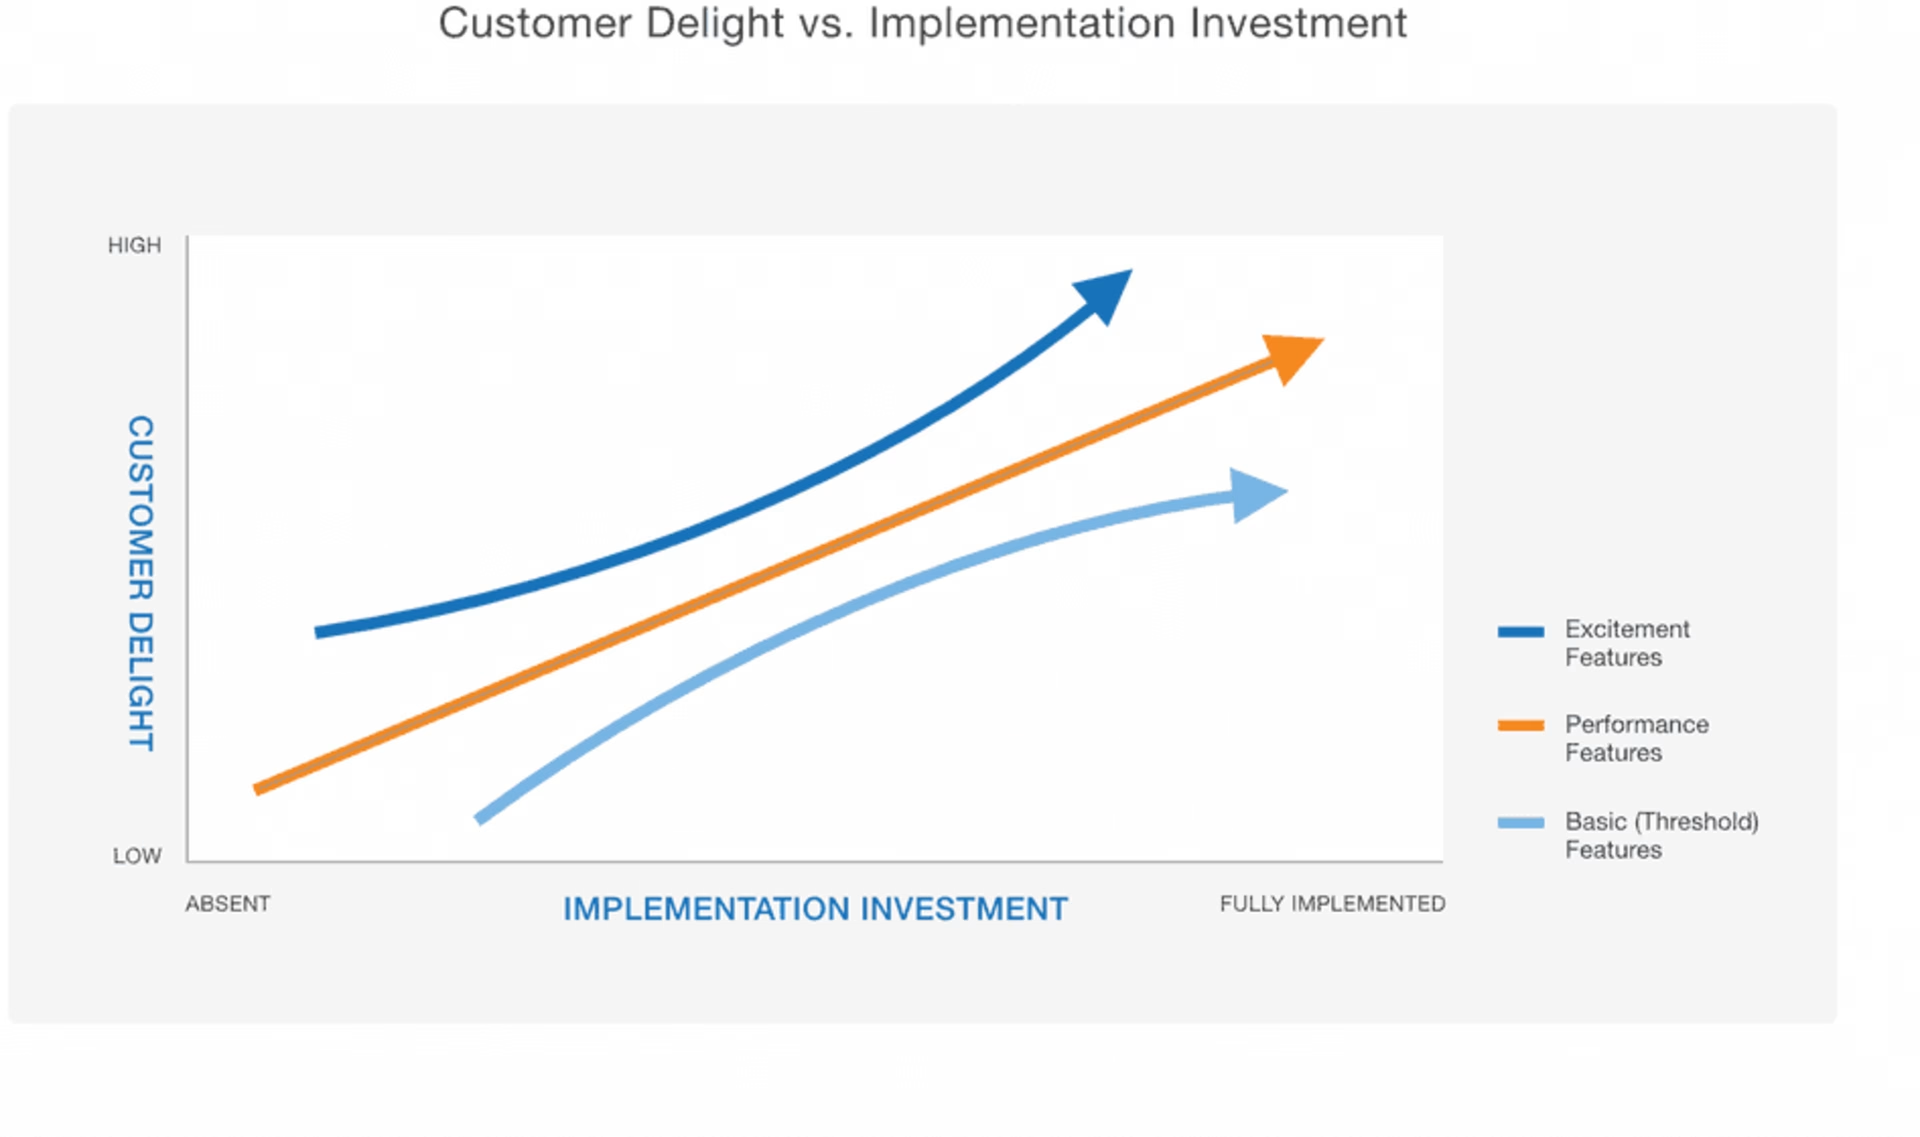
The Kano method compares the relative increase in customer delight against the effort to create a product. (Image via ProductPlan)
4. Cost of delay analysis
A cost of delay (CoD) analysis is a handy prioritization framework if money talks on your team—and let's be honest, money talks on every team. The CoD method determines how much potential revenue is lost by not working on a product or initiative. To use the cost of delay for product prioritization, you’ll add a time frame to compare multiple projects, turning it into 'cost of delay by duration', or CD3.
Cost of delay analysis pros:
Compare different projects on a single variable: revenue
Earn buy-in when revenue is a key initiative for the company
Cost of delay analysis cons:
You have to be able to quantify revenue for a product initiative
It doesn’t help if you only have a few similarly profitable and time-intensive projects
If you come up against a scenario where your 2 product options have a similar cost of delay by duration, turn to user insights to break the tie between equally lucrative features.
How to use a cost of delay analysis as a prioritization framework
We have a full cost of analysis process breakdown in this guide, but here’s a summary of the process:
Estimate how long a product will take to create. If you aren’t sure how long to dedicate to a product, look back on similar feature timelines as a starting point. Factors like cross-team collaboration can also impact your schedule.
Calculate the potential impact for each product. Metrics like activation, revenue, and retention are perfect for your cost of delay analysis. Use a consistent timeframe for your timeline and impact, like weeks or months.
Divide product outcome by time. You want to compare each product initiative's impact on a level playing field, so you have to account for how long it will take to complete. For example, if Initiative A takes 2 weeks and delivers $1,000 in weekly revenue, its CD3 score would be 500.
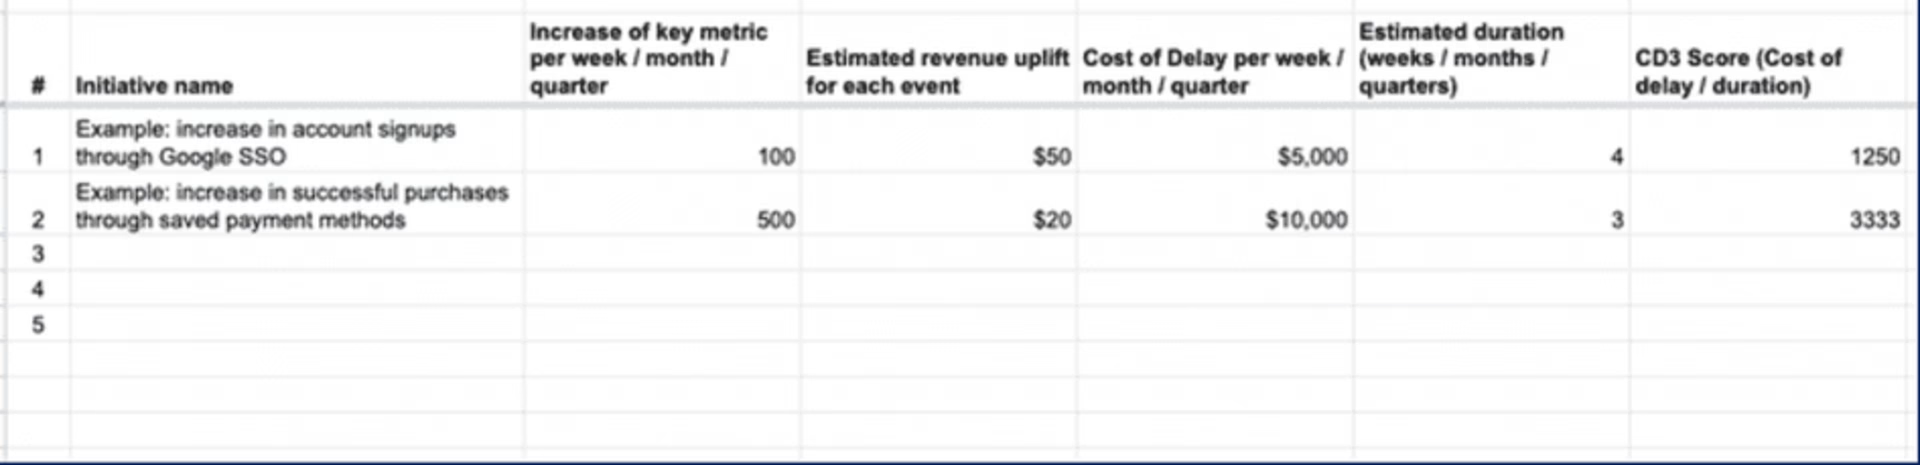
Here’s an example of a cost of delay analysis spreadsheet that anyone can use.
Contentsquare gives you a front-row seat to user experience insights
Contentsquare helps product managers make informed decisions with both quantitative and qualitative data you can add to prioritization frameworks. Leveraging Surveys, Heatmaps, Session Replay, and Journeys in your decision-making also helps you get stakeholders on board with your vision.